Retirement and Financial

120+ Small Business Statistics that Every Business Owner Should Know

From growth trends to access to funding - equip yourself with insights to stay ahead of the curve and elevate your small business potential.
In This Post:

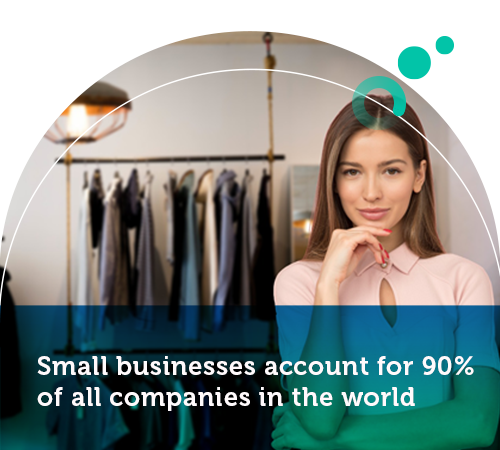
99.9% of all businesses in the U.S. are small businesses. 

Hence, it’s no surprise that they are the backbone of the American economy. They drive the local economies, support their communities, and create a massive number of job opportunities. In fact, from 1995 to 2020, small companies in the U.S. generated 62% of new jobs.  

A catch-all definition for a small business in the U.S. is one with fewer than 500 employees. However, the U.S. Small Business Association (SBA) has different defining standards for various industries. In the E.U., a small company has less than 50 employees, while, in Australia, it has under 20. Microbusinesses are small businesses that employ a few people. 

Suppose you’re thinking about venturing into the small business world. In that case, the small business statistics below give helpful insight into developing a solid business strategy.

General Small Business Stats

From freelancers to brick-and-mortar companies, food services, or auto repair shops, there are 32.5 million small firms in the U.S.  

These small business stats show why they are essential for the economy, what challenges they face, and other important facts. 

  • There are about 213 million small and medium enterprises (SMEs) globally. (Statista, 2021) 
  • Small businesses account for 90% of all companies in the world. (World Bank, 2022) 
  • There are 32.5 million small companies in the U.S. (SBA, 2021) 
  • 81% are companies with no employees, in contrast with 19% which have paid workers. (SBA, 2021) 
  • Approximately 22.6 million SMEs are in the E.U. (Statista, 2021) 
  • 83.8 million Europeans work in SMEs. Microbusinesses employ 38.4 million of them. (Statista, 2021) 
  • Germany, with 354,000, is the country with the smallest companies in the E.U. (Statista, 2021)
  • Globally, SMEs create seven out of ten jobs. (World Bank, 2022) 
  • 46.8% of all American employees work in small companies. That is 61.2 million people. (SBA, 2021) 
  • Small firms created 1.6 million new jobs in the U.S. (SBA, 2020) 
  • Small companies in Germany employ 6.8 million people. (Statista, 2021) 
  • Only 4.7% of American small businesses are 20+ years old. 13.8% are 11-10 years old, and 22.7% are six to ten years old. The vast majority of 51.6% of companies only exist for no more than five years. (Guidant Financial, 2022) 
  • 60.87% of Americans decided to start a business because they wanted to be their own boss. (Guidant Financial, 2022) 
  • Two-thirds of entrepreneurs changed industries when founding their companies. (Salesforce, 2021) 
  • The leading risk for 40% of small companies worldwide is cyber incidents, such as data breaches, cybercrime, etc. (Statista, 2022) 
  • The most significant problems for 23% of small firms in the U.S. are labor quality and inflation. (Statista, 2022) 
  • 70% of small enterprises use blogging as part of their marketing strategy, and 54% use SEO. (Statista, 2021)
  • There are 33.2 million small businesses in the US, making up 99.9% of all companies. (SBA, 2023) 
  • 81.7% have no employees, whereas the rest have paid workers. (SBA, 2023) 
  • SMBs in the US employ 61.7 million people, or 46.4% of all US employees. (SBA, 2022) 
  • From 1995 to 2021, small companies created 17.3 million new jobs in the US, compared to the 10.3 million created by large enterprises. (SBA, 2023) 
  • 45% of small businesses are getting ready for recession. (SWZD, 2023) 
  • The main strategies that SMBs are implementing to prepare for a recession are reducing non-essential spending (46%), preparing customers for a recession (35%), and re-evaluating vendors or contracts (30%). (SWZD, 2023) 
  • SMBs are two times less likely to implement a reduction in the workforce and close their offices or stores compared to larger companies. (SWZD, 2023)
  • Almost half of the small companies said hiring new talent in the last year was challenging. (Guidant Financial, 2023) 
  • As the leading causes of the difficulty in filling positions, organizations put forth the low number of applicants or lack of interest in their jobs (27%), candidates who lack the necessary work experience (18%), and competition from other employers (17%). (Guidant Financial, 2023) 
  • Sales positions are the most difficult to fill, followed by construction or maintenance, food service, healthcare or childcare, and management. (Guidant Financial, 2023)

Small Business Failure Statistics

The pandemic had a negative impact on all businesses, but small ones suffered the most significant blow. During this time, small companies had to deal with many challenges – reducing the number of employees, surviving revenue loss, and closing. The following SMB statistics show that it was a setback for many small-sized enterprises.

  • Globally, 26% of SMEs had to close between January and May 2020. (Global State of Small Business Report, 2020) 
  • The number of active small companies in the U.S. plummeted by 22%. (IZA, 2020) 
  • In Bangladesh and India, almost half of SMEs were closed. (Global State of Small Business Report, 2020) 
  • Industries that are customer-focused suffered the most. At the beginning of the pandemic, 54% of tourism agencies and 47% of hospitality companies had to close. (Global State of Small Business Report, 2020) 
  • From January to July 2020, firms in the U.S. had to reduce their employees by 39%. (PNAS, 2020) 
  • By the end of 2020, 55% of SMEs had fewer sales compared to the same months in 2019. (Global State of Small Business Report, 2020) 
  • 81% reported an overall decrease in sales in 2020. (U.S. Federal Reserve System, 2021) 
  • 33.5% of companies reported having a profit in 2020, whereas 48% operated at a loss. (SCORE, 2020) 
  • The number of microbusinesses that closed is 50% higher than large businesses. (Global State of Small Business, 2021) 
  • Globally, the number of closed women-owned companies (20%) was 4% higher than men-owned (16%). (Global State of Small Business, 2021) 
  • In the U.S., 20% of minority-led enterprises were closed compared to 13% of other SMEs. (Global State of Small Business, 2021) 
  • By the end of 2021, 75% of SMEs had to dismiss at least one employee, with 14% having to dismiss more than 11. (ZenBusiness, 2021) 
  • More than half of the owners didn’t take any time off during 2021. (Capital One Business, 2022) 
  • 66.2% of small companies reported a negative effect from COVID-19. (Statista, 2022) 
  • In 2020, about 1.2 million SMBs had to close down permanently. (SBA, 2023) 
  • However, this shouldn’t discourage entrepreneurs.  

    In fact, the small business statistics below show how resilient and adaptable small business owners are even when the economy is struggling. 

    • 83.36% of owners say they are optimistic their business will survive the pandemic. (Guidant Financial, 2022)  
    • 59% are even more motivated to grow their company. (Capital One Business, 2022) 
    • 63% are hopeful that business conditions will improve. (Capital One Business, 2022) 
    • The optimism index for small companies in the U.S. increased to 98.9 in December 2021, compared to 95 in January 2021. (Statista, 2022) 
    • About 30% of SMEs worldwide report an increase in driving sales. (Global State of Small Business, 2022) 
    • 73% believe that the financial situation will be better. (Statista, 2021) 
    • Since July 2021, small companies have reported an 11% increase in employment. (Global State of Small Business, 2022) 
    • 47% of American small companies have open job positions, and 26% will increase the number of employees. (Statista, 2022) 

Small Business Finance Statistics

When opening an enterprise, founders come across financial challenges they must overcome. For small businesses, the most significant challenges are access to funding and having consistent cash flow.  

Another hardship, especially with the Great Resignation, is retaining employees. Therefore, developing a sound business strategy helps to face these challenges. 

  • 30.4% of founders invested $1,000 to $10,000, whereas 21.7% invested less than $1,000. (Salesforce, 2021)  
  • 41% of women owners invested less than $10,000, and 13.1% didn’t use any funding. (SBA, 2022) 
  • 75% of entrepreneurs pull funds from their savings accounts to start the company. Only 19% rely on bank loans. (SBA, 2022) 
  • Small business loans of $1 million or less add up to $895 billion in loans. (SBA, 2022) 
  • 40% or 65 million firms have an unmet financial need of $5.2 trillion each year. (World Bank, 2022)
  • 49% of owners state they are constantly concerned about the company’s finances. (Capital One Business, 2022) 
  • 33% are worried about cash flow, 27% about inflation, and 26% about taxes. (Capital One Business, 2022) 
  • 63.71% are increasing compensations to fight employment turnover. (Guidant Financial, 2022) 
  • 77% of SMEs received national or federal government aid during the pandemic. (Salesforce, 2021) 
  • For 59% of Black and 65% of Latinx owners, the community’s financial support was crucial for survival during the pandemic. (Salesforce, 2021)
  • Small businesses account for 43.5% of the US gross domestic product. (SBA, 2023) 
  • Around 68% of small organizations applied to a bank for new credit in 2020. (SBA, 2023) 
  • 66% of SMBs are currently profitable. (Guidant Financial, 2023) 
  • Most owners spent $250K-$500K (27.3%) and $50K-$175K (26.2%) to start their businesses. 16.3% spent $500K-$1M, 14.2% spent $175K-$250K, 12.3% spent more than $1M, and only 3.7% opened their businesses with less than $50K. (Guidant Financial, 2023) 
  • The top industries for small companies are retail (18%), food and restaurant (12%), health, beauty, and fitness services (10%), construction and contracting (8%), and residential and commercial services (7%). (Guidant Financial, 2023) 
  • 35% of small businesses are new franchises, 33% are bought independent companies, 21% are new independent businesses, and 11% are bought existing franchises. (Guidant Financial, 2023)
  •  

Small Business Owners Statistics

  • The average annual salary among small business owners in the U.S. is $62,083. (ZipRecruiter, 2022) 
  • Small business statistics show that 75% of American entrepreneurs are somewhat happy (36%) or very happy. (39%). (Guidant Financial, 2022) 
  • 45.45% Boomers and 46.46% Gen Zs are the two largest age groups among small business founders in the U.S. (Guidant Financial, 2022) 
  • The percentage of small businesses in America owned by minorities is 18.3. (SBA, 2021) 
  • American entrepreneurs are primarily White or Caucasian (84.7%), and only 4% are Black or African-American, Hispanic, Latino, or Spanish origin, and 4% are Asian or Asian-American. (Guidant Financial, 2022) 
  • There are 23.4% women owners compared to 77.5% men in the U.S. (Guidant Financial, 2022) 
  • Women own 1.1. million small firms in the U.S. 36.8% have American Indian & Alaska Native women employers, compared to 19.8% White women employers. (SBA, 2021) 
  • Owners believe that the three critical entrepreneurial characteristics are creativity (57%), critical thinking (33%), and good communication (32%). (Salesforce, 2021) 
  • 25% of small business owners were females, compared to 75% of males. (Guidant Financial, 2023) 
  • Gen Xers own most small companies (47.2%), followed by Boomers (39.6%), Millennials (12.9%), and older generations (0.3%). (Guidant Financial, 2023) 
  • 76.2% of owners are White or Caucasian, 5.2% are Black or African-American, 4.8% are Asian or Asian-American, and 4.7% are Hispanic, Latino, or Spanish origin. (Guidant Financial, 2023) 
  • 42% of SMB owners are Republican compared to 19% of Democrats and 7% of Libertarians. The rest, 32%, are unaffiliated. (Guidant Financial, 2023) 
  • The primary motivators for owners to open a small business are preparedness to be their own boss (28%), dissatisfaction with corporate America (23%), and desire to pursue their passion (13%). (Guidant Financial, 2023) 
  • 72% of owners are somewhat or very happy. Only 4% are very unhappy. (Guidant Financial, 2023) 
  • The average annual salary for a small business owner in the US is $108,240. (ZipRecruiter, 2023)

Small Business Technology Statistics

  • 44.9% of companies founded during the pandemic use digital technology from the first day. (Salesforce, 2021) 
  • 14% of small businesses plan to spend more on technology in 2022. (SWZD, 2022) 
  • 58% of SMEs increased their technology investments to improve business agility and productivity. (Salesforce, 2021) 
  • 34% of small companies in the E.U. plan to adopt basic digital technologies, whereas about 25% plan to introduce advanced technologies. (Statista, 2020) 
  • 51-53% of firms use customer service, email marketing, and eCommerce software. (Salesforce, 2021) 
  • Small businesses are increasingly investing in digital services. 41% have invested in customer service, 40% in sales, 39% in marketing and operations, and 25% in human resources technologies. (Salesforce, 2021) 
  • In 2022, small companies plan to spend 21% of their budgets on laptops.  (SWZD, 2022) 
  • 6% will spend more on mobile devices and tablets in 2022. (SWZD, 2022) 
  • 20% of tech-focused small businesses report keeping an eye out for threats to data security as their most significant technical challenge. (Statista, 2021)
  • 40% of small companies plan to increase their IT budget next year. (SWZD, 2023) 
  • The main factors for increasing IT budgets are the need to upgrade the outdated IT infrastructure (52%), inflation (43%), and employee growth (37%). (SWZD, 2023) 
  • Small businesses are two times less likely to increase their IT budgets due to IT projects’ priority. (SWZD, 2023) 
  • Security incidents are five times less likely to be the reason for an IT budget increase within SMBs compared to large enterprises. (SWZD, 2023) 
  • 11% of small enterprises buy new technology services because they need better tech expertise, whereas 22% do it because of new features. (SWZD, 2023) 
  • Small companies will allocate 31% of their budgets to hardware, 30% to software, 21% to cloud-based services, and 17% to managed services. (SWZD, 2023) 
  • 56% of SMBs plan to implement Gigabit Wi-Fi networking, 50% will introduce IT automation technology, and 45% will take advantage of the Internet of Things. (SWZD, 2023) 
  • Most small organizations (69%) expect no change in their IT staff number. (SWZD, 2023)

Small Business & Social Media

We are all aware that people spend a lot of their time browsing social media. Over 95% of people use social networks. In fact, people often interact with companies through them. 

Therefore, small businesses can take advantage of social media and use it as a strategy. Why? Because owners can DIY the process at first, and it is a terrific way to hype a product or service. 

With the appearance of the Facebook marketplace and the Instagram Shop tab, it is now easier to market what you are selling. 

More than one billion monthly users in Q1 of 2021 used the Facebook marketplace, whereas Facebook shops reported one million monthly users 

90% of all Instagram users follow one or more businesses. 44% of all make a purchase on Instagram every week.

Using social networks to market the products and services of a small company is a great opportunity. However, it is important to create a good strategy to increase sales. Here are some tips that can help: 

  • Do research. Small businesses should find out what is trending on the market now. It is valuable to know what similar products or services are being sold.  
  • Use eye-catching visuals. It is good to showcase the product or service being used by satisfied customers. The photos or videos should look professional. 
  • Respond quickly. Both apps enable chatting with customers in real-time. And customers are more likely to make a purchase if they don’t have to wait too long for a response. 
  • Have a return policy. Since they can’t see it in person, customers are more likely to buy a product if they know they can return it if it doesn’t fulfill their requirements.

Small Business Growth Statistics

Small companies in the U.S. have been around since the 1600s. Back then, it all started with trading. Most colonialists owned land, and they used it to farm crops and produce clothing and soap. This is what they were trading. Thus began the development of small enterprises. 

Later, in the 1800s, with the nation’s independence, the economy flourished, and the monetary system grew. Small businesses experienced a boom. They started offering a greater variety of products, and people wanted to buy them. Suddenly, many owners realized that creating a unique product gives more freedom and success, so millions of patents were filed.  

Small companies faced their first and most significant challenge in the 1900s: corporate America. However, in the 1980s, big enterprises couldn’t hold their ground anymore because of foreign competition. This made way for small businesses to flourish and prosper. As a result, many people started showing interest in entrepreneurship, thus stabilizing small companies.

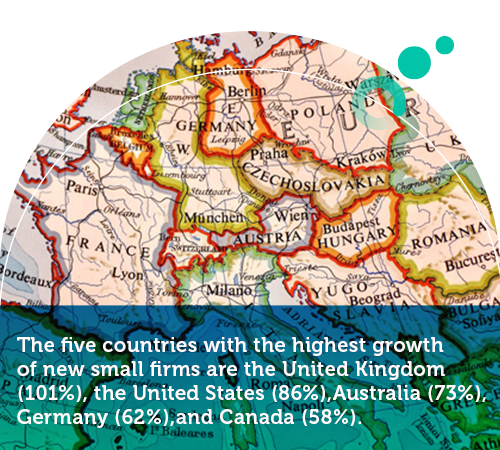
Since then, as we can see from the small business growth statistics, small enterprises have become a pillar of the American economy. 

  • Since 1998, the number of small businesses has dramatically increased. With about 20 million companies then, now there are over 32 million companies in the U.S. (SBA, 2021) 
  • While the number of employer businesses remains steady, non-employer ones grew from 15.4 million in 1997 to 26.5 million. (SBA, 2021) 
  • Small businesses are getting back on track after the pandemic. Compared to January 2020, currently, they offer 38.6% more jobs. (Opportunity Insights, 2022) 
  • Globally, 32% more small companies started operating in 2020. (MasterCard, 2021) 
  • The five countries with the highest growth of new small firms are the United Kingdom (101%), the United States (86%), Australia (73%), Germany (62%), and Canada (58%). (MasterCard, 2021) 
  • In 2020, approximately 1.07 million small companies opened for the first time. (SBA, 2023)

Small Business Revenue Statistics

  • Yearly, small companies generate $6 trillion of annual economic output. (U.S. Chamber, 2019)  
  • The average value SMEs add to the economy in the E.U. is 56% or 3.5 trillion euros. (Statista, 2021)  
  • As of January 2022, small companies’ revenue increased by 6.9%. (Opportunity Insights, 2022) 
  • 54% of small organizations expect their revenues to change in 2023. (SWZD, 2023) 
  • The retail industry has the most considerable revenue increase of 51%. On the other hand, professional services deal with a 26.5% loss. (Opportunity Insights, 2022) 
  • According to small business statistics, 65.3% of U.S. businesses are profitable. (Guidant Financial, 2022)

Small Business Trends

  • 77.3% of businesses that came out of the pandemic are more technology-based. (Salesforce, 2021) 
  • 45% plan to invest in analytics software to help them serve more customers. (Forbes, 2021) 
  • 61.8% offer current customer experience, like curbside pickup, instant communications, etc. (Salesforce, 2021) 
  • 39.7% are planning to invest in marketing efforts. (Guidant Financial, 2022) 
  • 36% will invest in social media, 54% in website, and 35% in SEO. (The Manifest, 2019) 
  • 3 in 4 businesses want to advance their employees’ skills to provide a better customer experience. (Forbes, 2021) 
  • 59.9% will continue making headway with remote employees. (Salesforce, 2021) 
  • 41% of small companies are planning to expand or remodel their business. (Guidant Financial, 2022)
  • 26% of small businesses plan to increase their staff in 2023, 18% will expand or remodel their business, and 18% will invest in digital marketing. Other plans include investing in traditional marketing (10%), investing in information services technology (7%), and investing in accounting services technology (6%). (Guidant Financial, 2023) 
  • Almost half of the small companies feel the economy is going into a long-term recession. (Guidant Financial, 2023) 
  • 76% of them expect that they will survive today’s economy. (Guidant Financial, 2023) 
  • 35% are confident in their business in today’s economy. (Guidant Financial, 2023)

Conclusion

Small business statistics show that owners might experience many rises and falls.  

In fact, they have not had a break since the start of COVID-19 in 2020. All the government’s lockdowns and measures in the last two years made it quite difficult for them to survive.  

Moving forward, small business owners are faced with another challenge at the moment – the increase in gas prices. However, most of them try to take different steps to contain the damage. Some of them are trimming services, whereas others are revising contracts. Many of them decide to pass on the extra costs to their clients.

Written by shorlister editorial team

Business Process Outsourcing Providers (BPO)

Browse our curated list of vendors to find the best solution for your needs.

Stay Informed

Subscribe to our newsletter for the latest trends, expert tips, and workplace insights!

Share on facebook
Share on linkedin
Share on twitter

Related Posts

How do Interest Earnings accumulate in a Deferred Annuity?

Understanding how interest earnings accumulate in a deferred annuity is crucial for making informed decisions about retirement planning. Explore the concept of deferred annuities, how interest earnings accumulate in deferred annuities, and the types of deferred annuities available in the market.

Succession Planning

30+ Succession Planning Statistics

Update your succession planning strategy with expert tips and unlock the potential for a seamless leadership transition, fostering a culture of long-term organizational success.